E-flows diagram
Each Irish WFD waterbody is assigned a required environmental standard (poor, moderate, good, high), and sensitivity to abstraction (low, medium, high).
E-flows are the flows associated with the allowable percentage abstractions that required to achieve the target environmental standard.
Qube's e-flows diagram presents estimates of natural and influenced flows along a reach together with the e-flows. Whilst the e-flows assessment is based on abstractions only, results are can be viewed alongside flows which are impacts by abstractions only, abstractions and discharges or all influences. This allows the sensitivity of results to other influences within the catchment to be reviewed.

The horizontal axis of the e-flows diagram represents the line of the principal channel. Distance from source, or any other starting point, is measured from left to right. The vertical axis represents the total flow of the river. E-flows are plotted alongside the natural and influenced flows. The influenced flows line represents the natural flows as impacted by abstractions, abstractions and discharges, or all influences.
See Table of Allowable Abstractions for E flows for a breakdown of the allowable abstraction for each environmental standard and sensitivity to abstraction.
Defining the e-flows stretch
Right-click on the map in the vicinity of your catchment and select 'E-flows'. Click on the resulting map to define the upstream and downstream points of your required e-flows stretch.
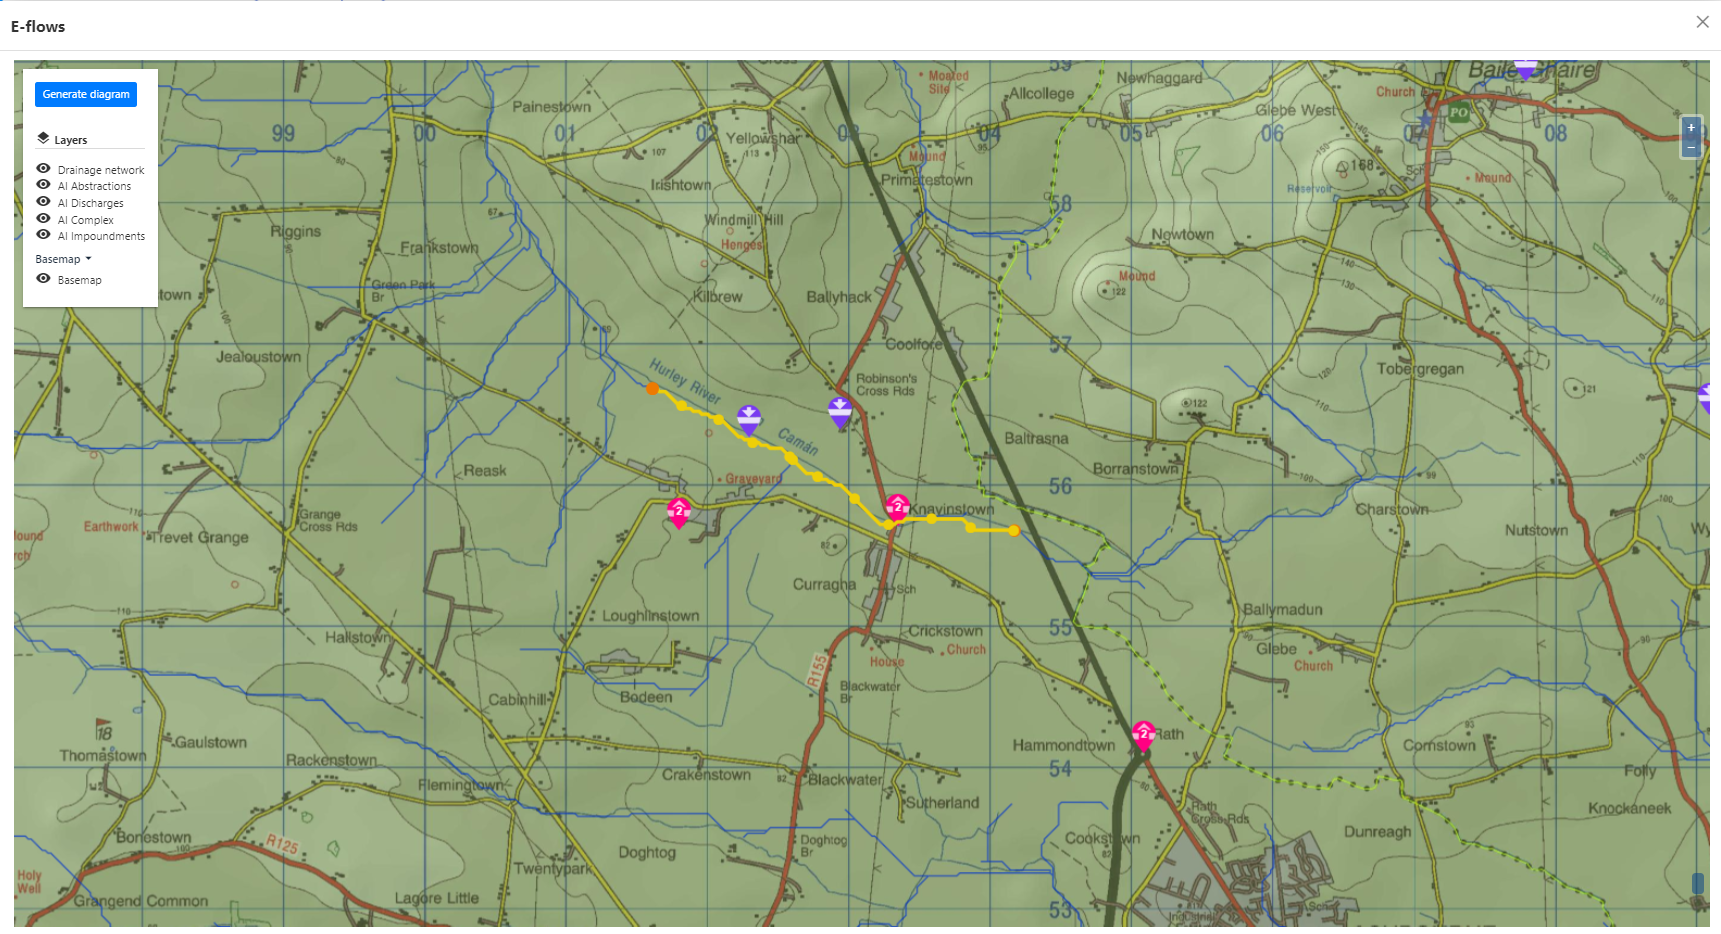
Qube then computes a route between the upstream and downstream points. Taking the total accumulated natural catchment area between the upstream and downstream points, it then divides the route into a number of nodes, indicating the locations where flow results will be estimated and presented.
If there is no possible route between the up- and downstream points, you will be asked to reselect them, similarly, if the points you selected are too close together. To adjust your route, simply drag the up- or downstream points.
Qube selects the intermediate nodes along your route to ensure the e-flows diagram approximately captures the underlying area accretion using the follow criteria:
- Select nodes where the incremental accumulated area between nodes is greater than 2% of the total reach accumulated (minimum 1km2). This identifies significant confluences relative to the size of the downstream catchment being modelled.
- Select the nodes immediately upstream of these accumulated area nodes to model the catchment immediately upstream of the confluence.
- Finally, select additional nodes where the distance between adjacent nodes exceeds 10% of the length of the total upstream to downstream reach (subject to a minimum distance of 200m).
Click 'Generate diagram' to name and submit your request.
Processing the results
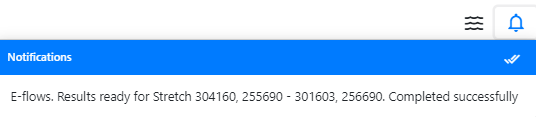
Once you have submitted your request, the notification bell will update you on the progress of the background calculations.
Results
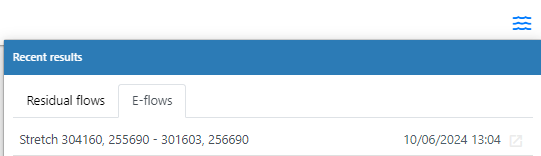
To view your results select the run from the notifications window, or the e-flows recent results lists, accessed using the 'waves' icon to the left of the notification icon. Results will remain in the list for 24 hours.
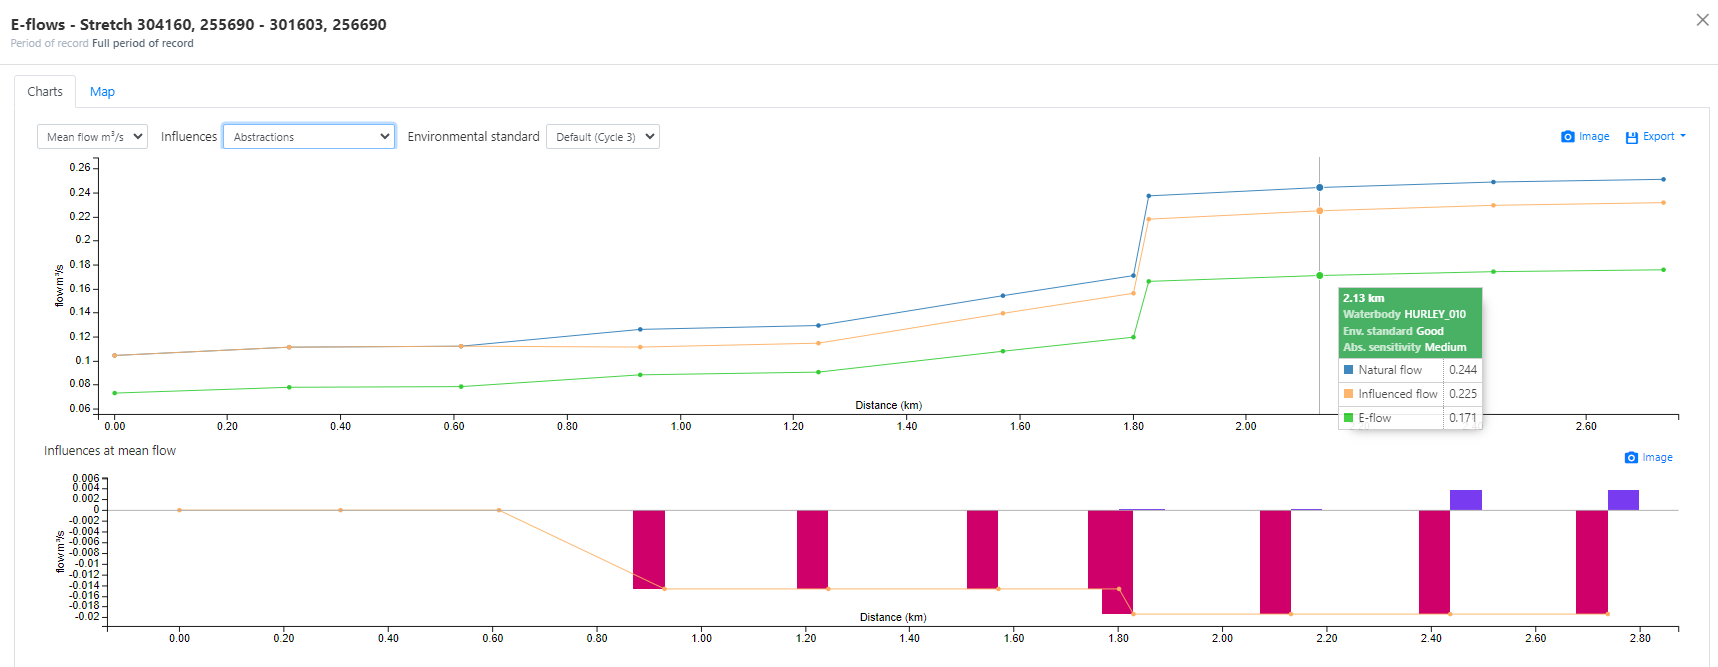
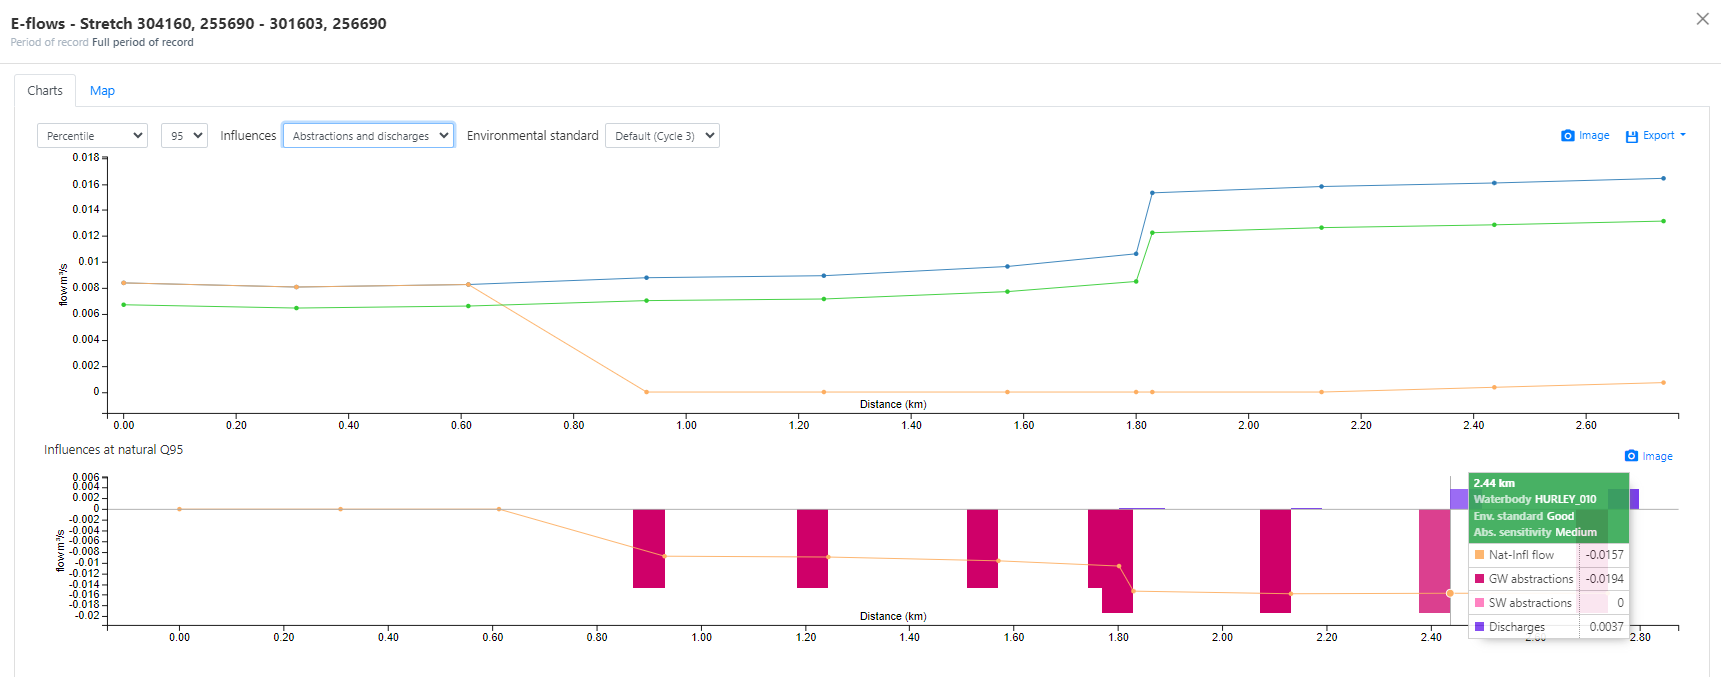
Charts
The charts tab first shows the natural (blue), influenced (orange) and e-flows (green) flow for the selected flow statistic, plotted against distance downstream. The second chart gives a breakdown of the total influence by feature type (surface water or groundwater abstractions, discharges and impoundments) at each point for the selected flow percentile, along with the difference between the natural and influenced flow.
You have the choice of plotting results for the annual or monthly mean flows or a single flow percentile. See examples below. The drop down list 'influences' allow you to select whether the influenced flows should include abstractions only, abstractions and discharges or all influences. You can also select different environmental standards which will result in recalculation of the e-flows in the upper chart.
The exported csv file and map tab present the results for the flow statistic that you selected on the charts tab.
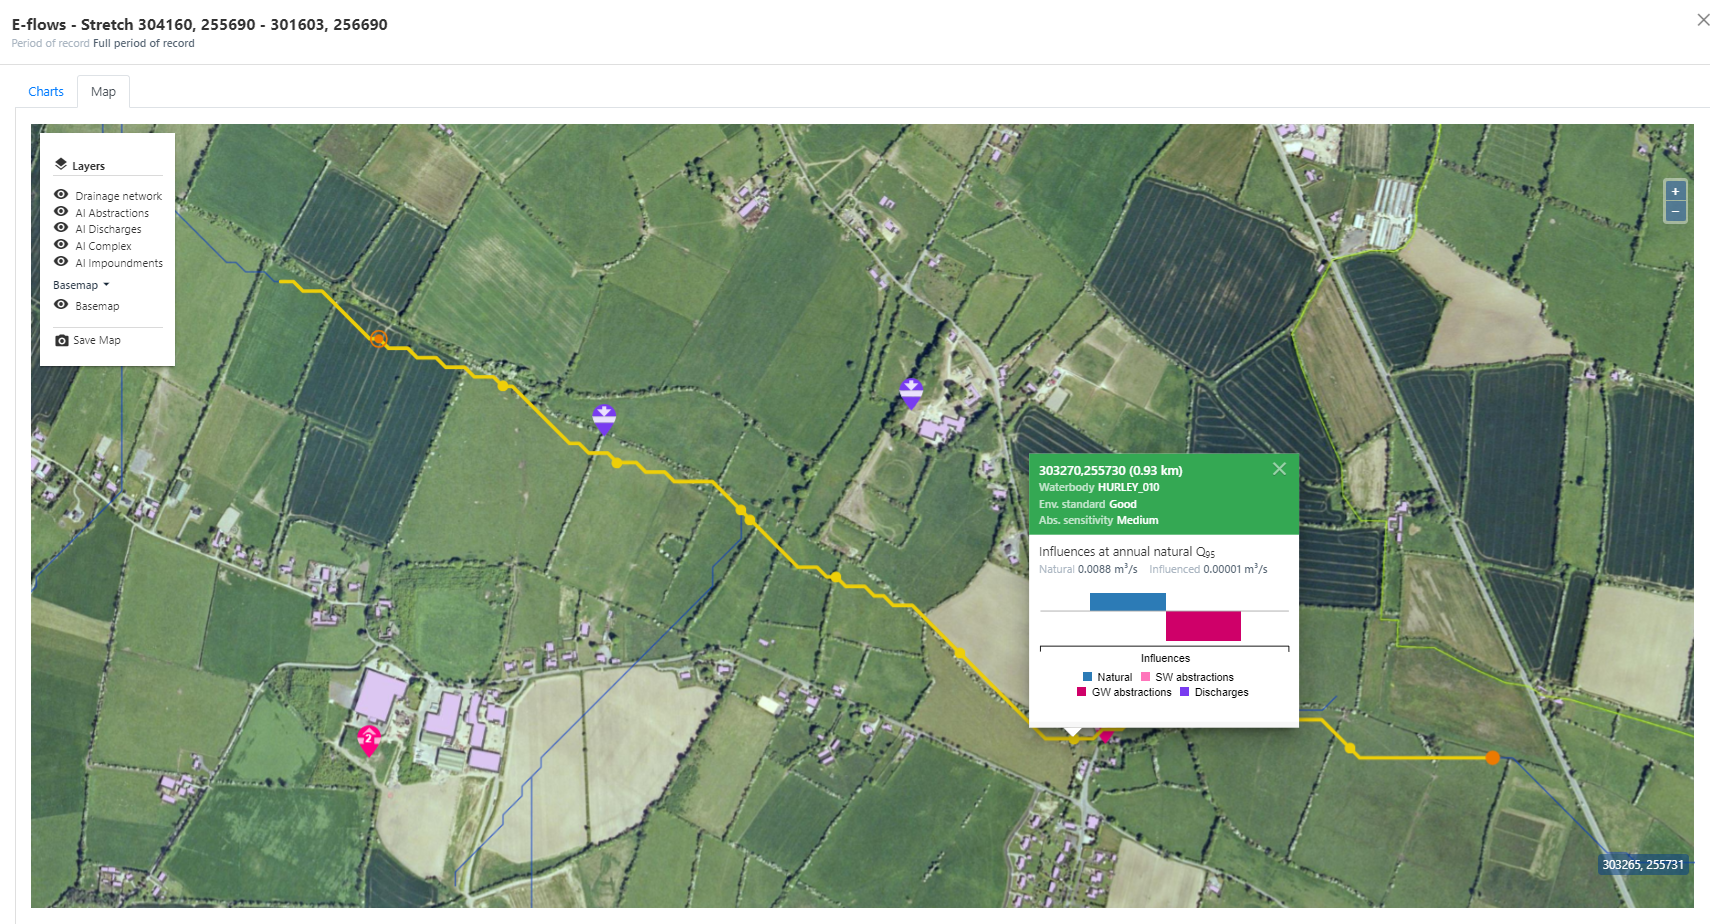
Map
The map tab displays the e-flows diagram route and points highlighted on the drainage network, along with artificial influence features and gauges. Hover your mouse pointer over nodes to reveal the natural, influenced and e-flow, as well as a summary of the artificial influences for the flow statistic selected on the charts tab. The environmental standard and abstraction sensitivity is also shown.